Roadsoft users can take advantage of the Safety Analysis tools to filter, sort, and analyze patterns in the crash data using network-screening algorithms. Potential network screening can help identify problem areas at road segments, intersections, and on curves. Roadsoft includes NCHRP (National Cooperative Highway Research Program) documentation to find countermeasures that will reduce the frequency and severity of crashes.
The Collision Diagram tool provides a visual representation of crash data at a given intersection. Collision diagrams use icons to denote different crash types and their locations within individual intersections. Using these graphs and charts, you can easily identify specific crash factors and pick locations within intersections to install new safety measures. Multiple levels of detail and analysis are available, allowing a user to go from network level analysis and drill down to viewing the actual incident reports for individual crashes.
The Trend Analysis tool lets you to compile, summarize, and graph specific aspects of crash. Analysis can be based on a variety of factors, including day of week, severity of crash, weather conditions, road surface conditions and more. You can also create digital or print copies of the analysis results, which you can use in presentations to constituents and decision-makers.
Information tracked using the Safety Analysis tools includes:
- Rank and sort intersections, segments, and curves based on crash characteristics and frequency (such as date and time)
- Intersection crash diagrams
- Graphs of crash data
- NCHRP documentation
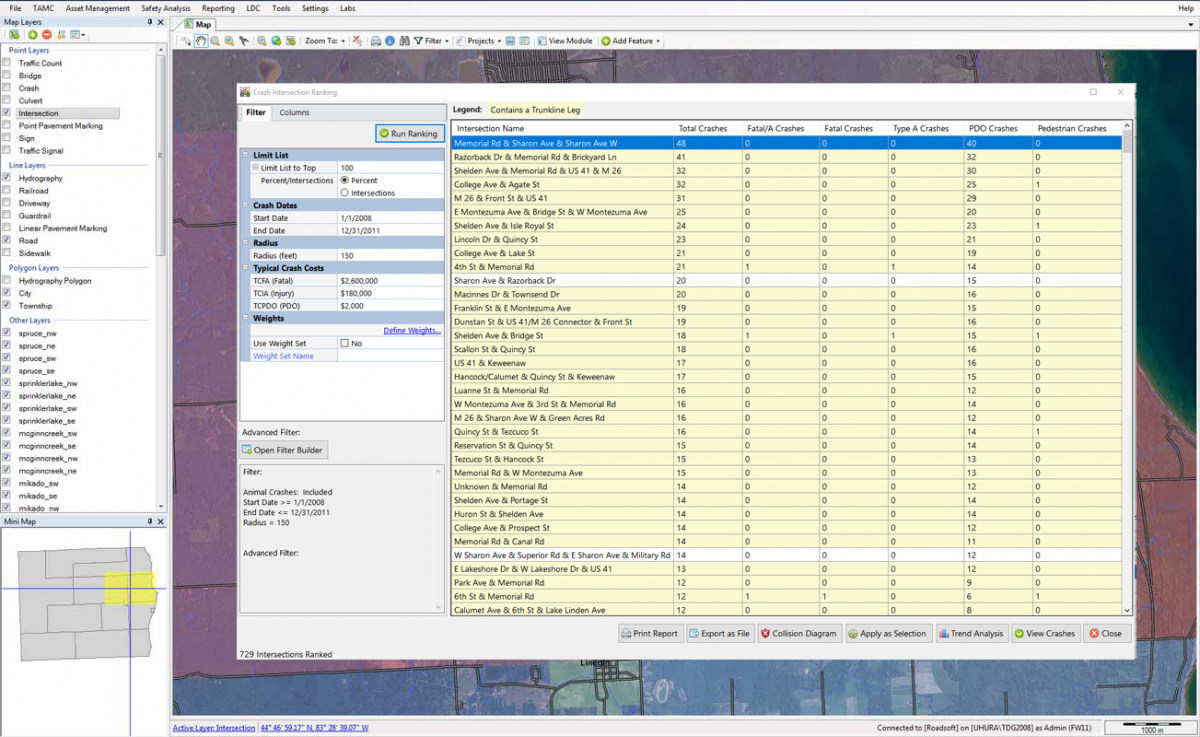
The Intersection Ranking window is used to identify and rank high-risk intersections
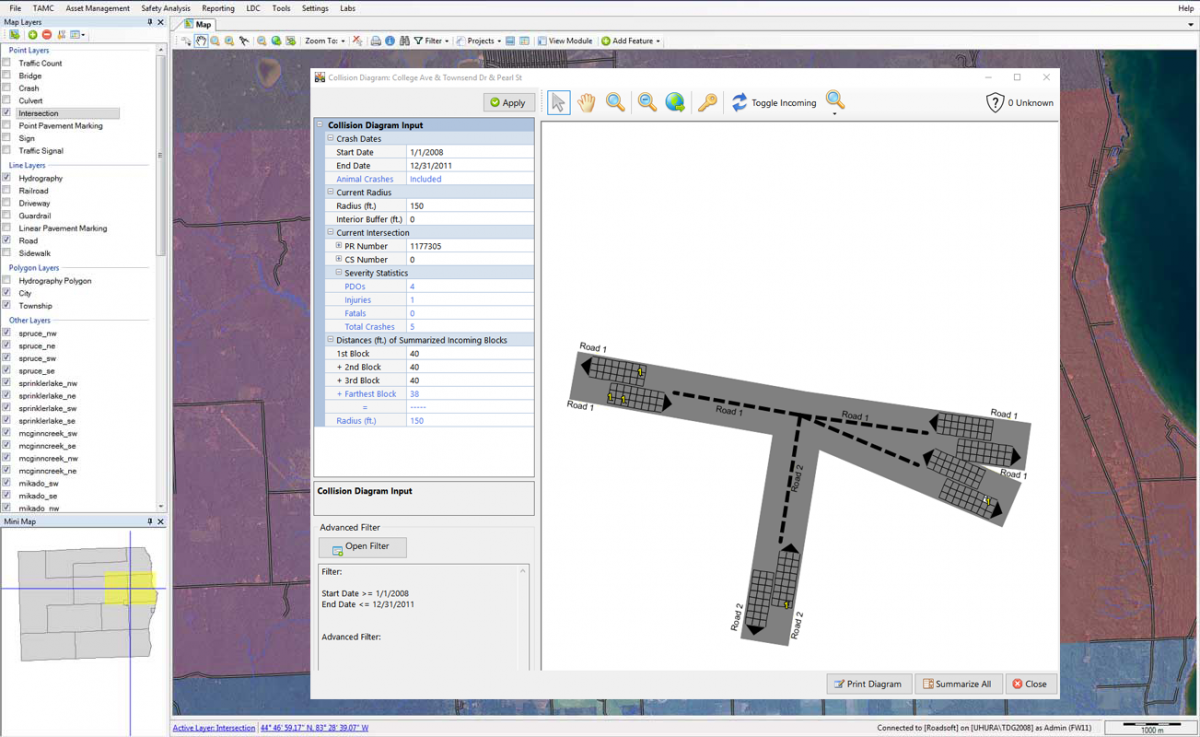
A Collision Diagram of an intersection
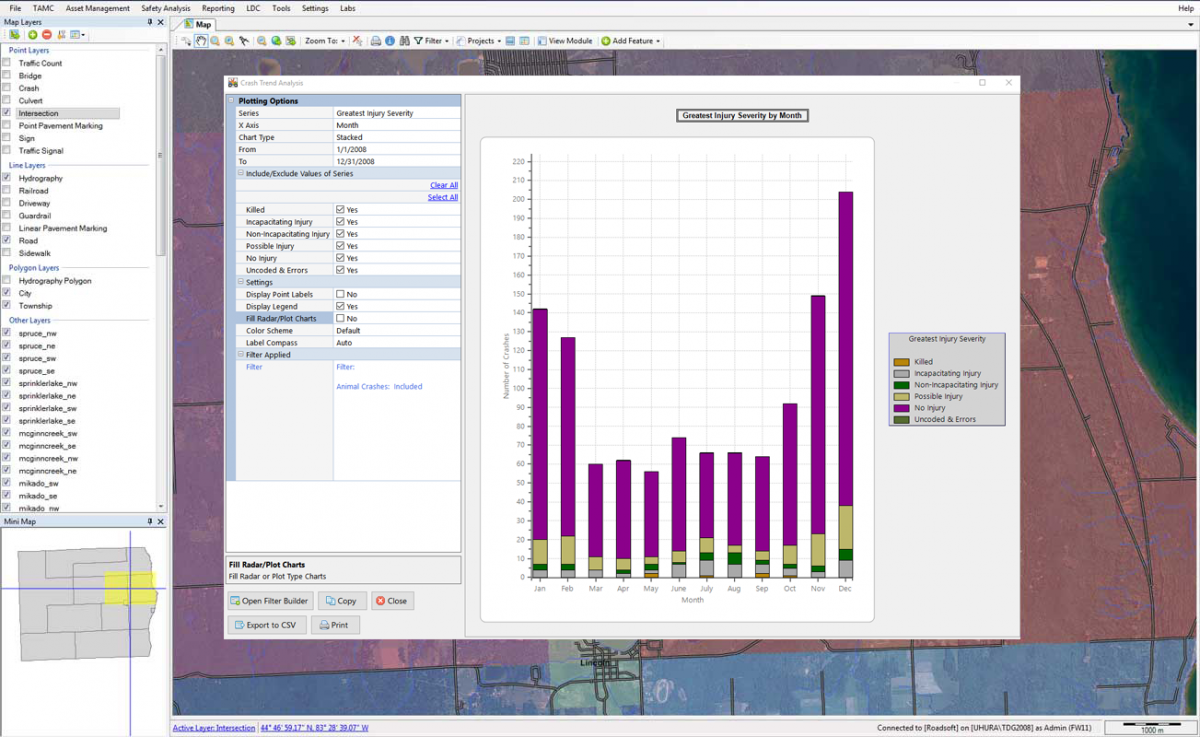
A graph created with the Trend Analysis tool
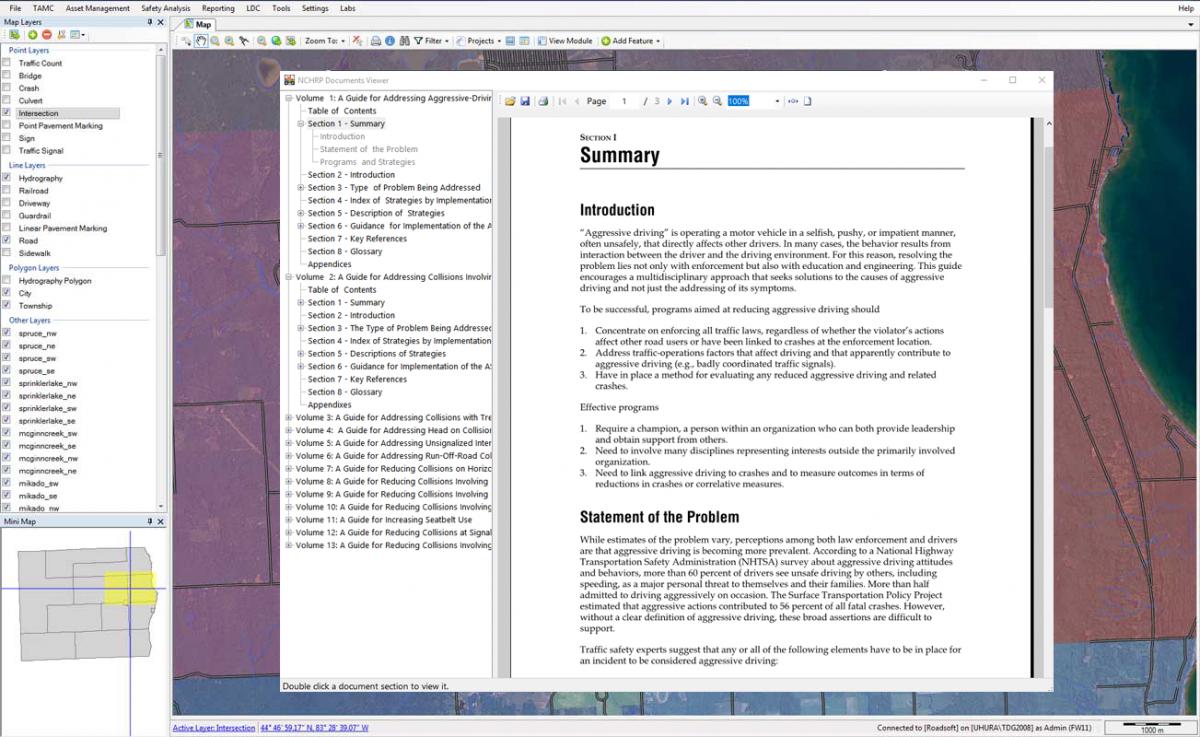
The NCHRP Index for browsing safety countermeasure documentation