Use the Strategy Module Overview
The purpose of Strategy Evaluation & Optimization components of Roadsoft is to create and evaluate asset management plans for maintaining pavement assets. Maintenance activities can be directly specified or they can be calculated from budgetary and maintenance activity constraints (optimization).
The component applies deterioration and maintenance at the network level rather than the segment level. When running strategy evaluation and optimization models, the application of treatments in the strategies occur on groups of lane miles as determined by the selected filter, not to individual segments.
The specified filter for a strategy reduces the associated road segments to a summary list of “lane-miles at Remaining Service Life (RSL) value” for each surface subtype in the filter. The filter summary list describes the aggregate, network level, condition of the roads being evaluated. The key assumption is that, taken together, roads will behave as described by their deterioration curve models. To accomplish aging (deterioration), Roadsoft optimization shifts lane-miles to the next lower RSL value. Treatment activities move lane-miles from the treatment trigger range to the treatment reset range. See Add or Edit a Treatment for establishing treatment trigger and reset ranges.
When creating a new strategy or opening a saved strategy, the main form called the Strategy Module opens. This is where most strategy activities occur. The form has several different parts to the overall layout:
Strategy Settings
Rating Summary
Strategy Design
Strategy Graphs
Menu options (Save, Edit, Optimize, Reports, and Compare)
The Strategy Module layout is customizable using docking and pinning features. See Pin & Unpin Windows and Dock & Undock Windows for help customizing the layout and to reset the module layout back to its default settings.
See Create or Open a Strategy to begin making a new strategy or editing an existing strategy. For more information on treatment visibility, see Set Treatment Visibility. See Compare Strategies for assistance with comparing strategies.
The Strategy Module only works with Asphalt, Concrete, and Seal Coat pavement types and their associated subtypes.
Strategy Settings
Strategy Settings refer to a variety of parameters that are set prior to a designing a strategy. Displayed values are not editable from within the Strategy Module. See Create or Open a Strategy for additional information on establishing or editing strategy settings within Roadsoft.
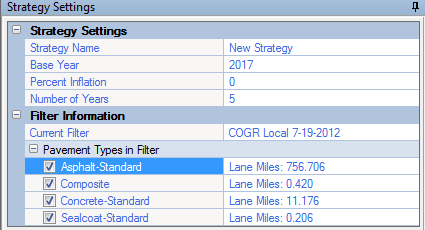
Base Year – determined by the entered value in the Evaluation Date field, the base year is the first year a strategy is applied.
Percent Inflation – an annual rate of inflation that alters treatment costs.
The % Inflation value defaults to zero if no other value is set.
Number of Years – the number of years applicable to the strategy.
The Number of Years value defaults to five years if no other value is set.
Filter Information – shows the road filter settings to which the strategy applies.
Rating Summary
The Rating Summary section of the Strategy Module shows the Remaining Service Life (RSL) for the strategy based on the selected Filter, Number of Years, and Evaluation Date as defined in the Strategy Settings. The summary includes the total lane miles for all pavement types combined, total lane miles by pavement type, and total lane miles by its corresponding Pavement Surface Evaluation Rating (PASER) value grouped by good/fair/poor subsections of each pavement type. By default, the underlying RSL and PASER rating data are not displayed.
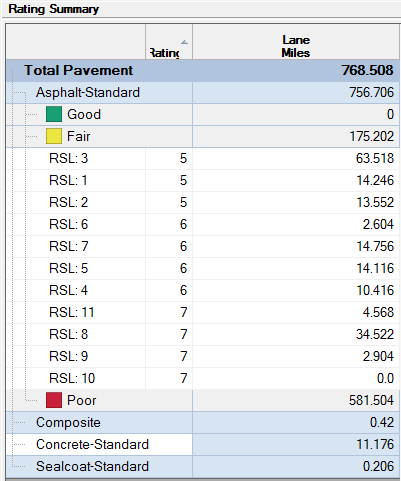
There are some navigational options for the Rating Summary section.
Select Good, Fair, or Poor fields under any of the pavement types in the window to view or hide the RSL and PASER ratings that make up the totals in the Good/Fair/Poor subsections.
Select the pavement type fields (Asphalt-Standard, Composite, etc.) to view or hide the underlying Good/Fair/Poor data for the selected pavement type.
Strategy Design Tab
To define a new or edit an existing strategy, add treatment records (alternately called plans or planned treatments) to treatments in the Strategy Design tab. See Design a Strategy for detailed information on creating a new strategy or editing an existing strategy.
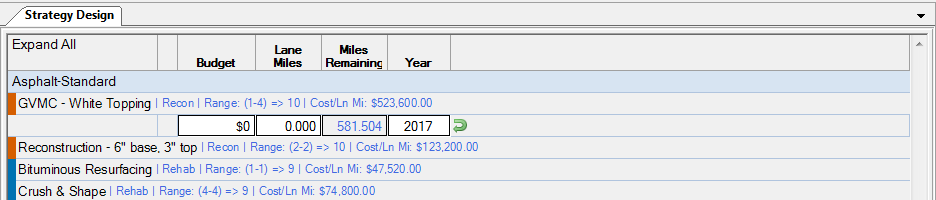
There are some navigational options for the Strategy Design tab.
Select Expand All in the first column to show the first treatment record for all treatments.
For previously saved strategies, all completed treatment records will remain displayed.
Select Budget or Lane Miles headers to hide the first treatment record for all treatments.
For previously saved strategies, all completed treatment records will remain displayed.
Strategy Graphs
Strategy graphs visually display the result of applying a strategy to a road network or a pavement subtype of a road network. The chart updating occurs in real-time with the addition or editing of treatments in the Strategy Design area. The strategy graphs available are line graphs, bar graphs, and stacked bar graphs.
Form locations used in these descriptions are based on the default layout of the Strategy Module.
Strategy graphs are located in the right-most window of the Strategy Module. Three graph groups display the strategy data based on various criteria (depending on the subtype desired). Select individual tabs to bring the selected graph group to the top of the window.
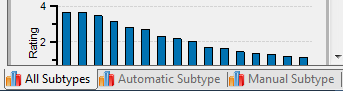
The three graph groups include:
All Subtypes - shows all graphs with all pavement subtypes.
Automatic Subtype - shows the graphs by subtype selection on the Strategy Design form.
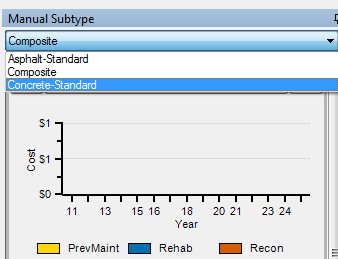
Manual Subtype - shows only the graphs with the pavement subtype based on manual selection of a specific subtype via a drop-down menu located at the top of the Manual Subtype graph section.
The drop-down menu is only visible if the Manual Subtype tab is at the front of the window.
Each graph group includes the following graphs:
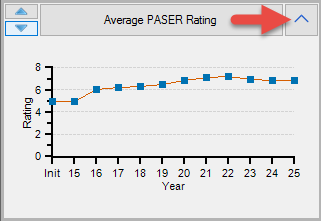
Show and hide graphs by selecting the arrow on the right side of each graph title.
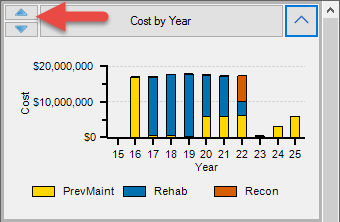
Cost by Year graph shows preventative maintenance (PrevMaint), rehabilitation (Rehab), and reconstruction (Recon) costs per year.
Average PASER Rating graph shows the estimated average PASER rating by year in line graph and bar graph form.
Average Remaining Service Life graph shows the estimated average remaining service life by year in line graph and bar graph form.
Types of Maintenance Performed graph shows preventative maintenance (PrevMaint), rehabilitation (Rehab), and reconstruction (Recon) lane-miles per year.
Rating Distribution graph shows the estimated percent of Poor (PASER 1-4), Fair (PASER 5-7), and Good (PASER 8-10) PASER ratings by year.
Reorder graphs by clicking the graph name and dragging the graph to a new location or by using the up/down arrows on the left side of each graph title.
The graph group window, like most windows in Roadsoft containing the pin icon , are docking and undocking windows. See Pin & Unpin Windows and Dock & Undock Windows for help customizing the layout. In addition to docking and undocking the whole graph group window, each individual graph group tab can be docked or undocked.