Use the Extended Service Life (ESL) Calculator
The Extended Service Life (ESL) Calculator is a data analysis tool in Roadsoft for the comparison and assessment of road treatments. ESL calculations are useful for making informed decisions on which road treatments to use based upon extended service life, cost, politics, the environment, and road factors such as location or frequency of use.
The ESL calculator uses existing agency data (Pavement Surface Evaluation and Rating (PASER) data and associated deterioration curves) to predict the pavement life before and after a treatment, which can determine an extended service life provided by the treatment.
Open the Extended Service Life (ESL) Calculator
Select the Asset Management option from the main menu.
Select Pavement Management from the drop-down list.
Select Extended Service Life Calculator from the drop-down list. This will open the Extended Service Life Calculation window.
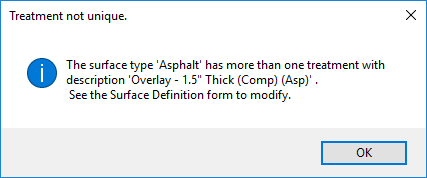
Unique treatment names are required in order for proper calculation by the ESL Calculator. The Extended Service Life Calculation window will fail to open and an explanatory dialog box will appear when treatments do not have unique names. Adjust any treatments specified in the explanatory dialog box before running the ESL Calculator. See Add or Edit a Treatment for help with editing treatments.
Define ESL Options
Options are adjustable to customize the results of the ESL Calculations. Leave the settings at the default configuration to view a greater amount of data, or change them by using the instructions below to filter for specific segments.
Edit the Data Points Before Treatment (minimum) field to the desired number of data points for the calculation.
This information refines ESL calculation results by only identifying road segments that meet the specified number of collected historical data points prior to the implementation of the specified treatment. The default is one data point.
Edit the Data Points After Treatment (minimum) field to the desired number of data points for the calculation.
This information refines ESL calculation results by only identifying road segments that meet the specified number of collected historical data points after to the implementation of the specified treatment. The default is three data points.
Add a new or saved filter if desired.
Filters allow an agency to narrow down data used for ESL calculations. See Use the Filter Builder for help with creating new filters or using saved filters.
Select the + icon to the right of the Network (Optional) field to access the following filter options.
Choose the Select a Saved Filter… link to access previously saved filters from the Load Saved Filter window.
Select a filter from the list.
Select the OK button.
Choose the Open Road Filter Builder… link to create a new filter.
Select an ESL Calculation Method. This determines how the ESL calculations display in the chart on the bottom of the window.
Select Additional Years Until CDP Reached. This is the default setting. When selected, it displays the extended service life (in years) that a capital preventative maintenance (CPM) treatment adds to a selected road segment before reaching the critical distress point (CDP).
Select Years Until Rating Repeats. This will display the number of years that it will take for a specific road segment to reach the same PASER rating that it had before the ESL treatment.
Select Manage Analyses (Optional).
If there are specific segments, data points, or historical ratings to be included or omitted in the calculations, use the Manage Analyses option apply a previously saved analysis, to save the current analysis, or to delete an analysis.
Select the + icon to the right of the Manage Analyses (Optional) field.
Save any analyses for future reference, or if they been open for an extended amount of time. Revisit saved analyses through the Open a saved analysis… option.
Select the Open a saved analysis… link to access previously saved analyses.
When a saved analysis is selected, the specific configuration settings will apply to the current calculation for a segment.
Select the preferred analysis.
Select the Load button.
Select the Save analysis… link to save the current analysis.
Name the analysis by entering a name for the current analysis in the Name field or by selecting a previously saved analysis from the drop-down list.
Select the Save button.
If a previously saved analysis name was selected, select the Yes button in the Save Analysis window to overwrite the old analysis with the current one or select the No button to cancel.
Select the Delete analysis… link.
Select the desired saved analyses for deletion.
Select the Delete button.
Select the Yes button to confirm the delete, or select the No button to cancel.
Select a Treatment for the Calculation
In order to complete an ESL calculation, treatment selection is necessary. Make treatment selections in the bottom left table. By selecting a CPM treatment based on the Surface Sub Type, each road segment in an agency’s data set that has received the selected treatment will display.
The ESL Calculator can only process and display one treatment option at a time. Use the Save Analysis… feature (in the Manage Analyses section of the Options table) to save each treatment analysis for future review as needed.
Navigate to the table displaying Surface Type and Treatment (below the Options table).
Determine which Surface Type and Surface Sub Type your agency will be working with.
Select the Treatment field for the desired surface sub type to activate the drop-down list option.
Upon activation of the treatment drop-down list, a downward facing triangle appears to the far right of the Treatment field.
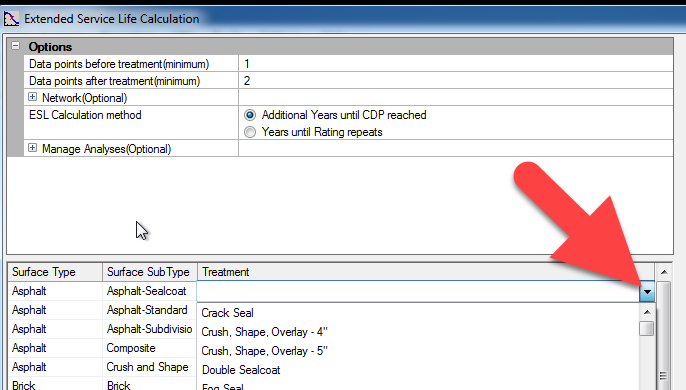
Select the desired treatment from the drop-down list.
A window in the top right corner will populate with a list of all the road segments in an agency’s data set that have undergone the selected treatment.
View & Understand Results
The ESL Calculator provides a variety of information about an agency’s data set, but in order to use it as an asset management resource, it is important to understand what the different tables and associated chart communicate. There is not a linear process for working through the data because the analysis information varies depending on the agency and their goals. Use the following instructions to gain a general understanding of the ESL Calculator tables and associated chart, and then adjust calculations depending on individual agency needs.
Navigate to the table that populates in the top right corner of the Calculation window. This table displays the road segments that have undergone the selected treatment. Each listing includes:
Use: Includes a textbox so agencies can decide if they would like to include a certain road segment in the Average ESL calculation
TreatDate: Shows the date that the pavement was treated
FullName: Describes the name of the section that was treated
Bmp (Beginning mile point): Indicates the beginning location of the treatment on the identified pavement segment
Emp (End mile point): Indicates the ending location of the treatment on the identified pavement segment
ESL (Extended service life): Expresses the time in years that the treatment added to the pavement’s service life.
Double click on the road segment to be analyzed. This populates:
A chart depicting the deterioration curve for the selected pavement segment on the highlighted date.
Another table below that displays the historical PASER ratings for the selected segment.
Navigate to the table displaying historical PASER ratings. This shows:
Date: Displays the when a PASER rating was recorded for the pavement segment.
Treatment: Indicates whether the treatment was applied for the selected date.
Rating: Provides the given PASER rating for the selected road segment for the selected date.
Use Rating?: Includes a checkbox so agencies can decide whether to include certain historical ratings for the highlighted pavement segment in the Deterioration Curve.
Entering incorrect or inconsistent ratings could affect the overall ESL. The Use Rating? option enables agencies to prevent skewed results.
Uncheck any inconsistent PASER ratings
Select the Save button to the right.
Only the checked ratings will appear in the deterioration curve on the bottom of the ESL Calculation window.
Navigate to the chart depicting the deterioration curve. All of the checked PASER ratings in the table noted above will display. Depending on the ESL Calculation Method chosen, this will display information according to the following formats:
The difference between the two calculation methods is the representation of ESL Year Two.
Additional Years Until CDP Reached (default), which includes:
Rating Points (plotted data squares): Represents the specific data points representing the PASER rating given for the recorded years, taken from the agency’s data set.
Previous pavement treatment (dashed gray curve line): Shows the deterioration curve calculated from the plotted historical PASER data.
This appears as Treatment Unknown in the legend when no previous treatment data is available.
Selected CPM treatment (solid green curve line): Highlights the deterioration curve for the new CPM treatment.
CDP Rating (horizontal dashed red line): Indicates the Critical Distress Point (PASER 5) where a pavement requires preventative maintenance or structural construction.
ESL Year One (vertical dotted green line): Demonstrates the increase in PASER rating the selected CPM treatment provides in the first year.
ESL Year Two (vertical dotted yellow line): Demonstrates the number of years that the selected CPM treatment adds to the service life of the pavement before further preventative maintenance is required.
Years Until Rating Repeats, which includes:
Rating Points (plotted data squares): Represents the specific data points representing the PASER rating given for the recorded years, taken from the agency’s data set.
Previous pavement treatment (dashed gray curve line): Shows the deterioration curve calculated from the plotted historical PASER data.
Selected CPM treatment (solid green curve line): Highlights the deterioration curve for the new CPM treatment.
CDP Rating (horizontal dashed red line): Indicates the Critical Distress Point (PASER 5) where a pavement requires preventative maintenance or structural construction.
ESL Year One (vertical dotted green line): Demonstrates the increase in PASER rating the selected CPM treatment provides in the first year.
ESL Year Two (vertical dotted yellow line): Demonstrates the number of years that the selected CPM treatment adds to the service life of the pavement the PASER rating reaches the same point it was before the treatment.
Create & Save Reports
The ESL Calculator includes two report options, the Summary Report and a Detail Report. The Summary Report provides a summarized treatment history for the selected treatment for individuals, boards, and taxpayers to see the ESL Calculations for different CPM treatment options. The different report options include:
Create a Detail Report:
Compiles the deterioration curve chart and PASER rating table for each individual pavement segment identified in the top right table. The Detail Report displays one segment per page. If there are 100 segments selected, then the report will be 100 pages.
Select the Detail Report button in the center of the Extended Service Life Calculation window.
Select File from the report main menu options.
Choose how the file will export:
Excel
CSV
Enter a name for the report in the Name field.
Select the Save button.
Create a Summary Report:
Compiles only the information from the table in the top right of the Extended Service Life Calculation window
Select the Summary Report button in the center of the Extended Service Life Calculation window.
Select File from the report main menu options.
Choose how the file will export:
Excel
CSV
Enter a name for the report in the Name field.
Select the Save button.
Print Chart:
Prints just the deterioration curve chart for the selected segment in the top right table.
Select the Print Chart button below the PASER rating table.
Select the desired printer location.
Select the OK button.